%20(1).png)
Insights
Let Balentine be your guide on your wealth management journey.
Balentine experts offer their authentic take on the latest financial topics, including our exclusive market publications, news, community events, and more. Select the topics that interest you, or browse our full collection of resources from trusted thought leaders.
Top Insights
Start with these core pieces to understand how our approach to financial planning, investments, business advisory, and legacy is different.


Insights
Let Balentine be your guide on your wealth management journey.
Balentine experts offer their authentic take on the latest financial topics, including our exclusive market publications, news, community events, and more. Select the topics that interest you, or browse our full collection of resources from trusted thought leaders.
Topics
Thank you! Your submission has been received!
Oops! Something went wrong while submitting the form.

.png)
Our best thinking on what's happening in the economy and markets and why it matters to investors.
Every quarter, we provide our best thinking on what's happening in the economy and markets and why it matters to investors. Every year, we share seven-year projections that form the basis of strategies we design to help clients achieve their goals.
.png)
.png)
.png)
A Legacy of Growth
The Atlanta Business Chronicle honored Robert Balentine with the 2026 Ann Cramer Lifetime Achievement Award. This feature highlights Robert's legacy of growth: building a leading wealth management firm while advancing red spruce restoration through Southern Highlands Reserve.
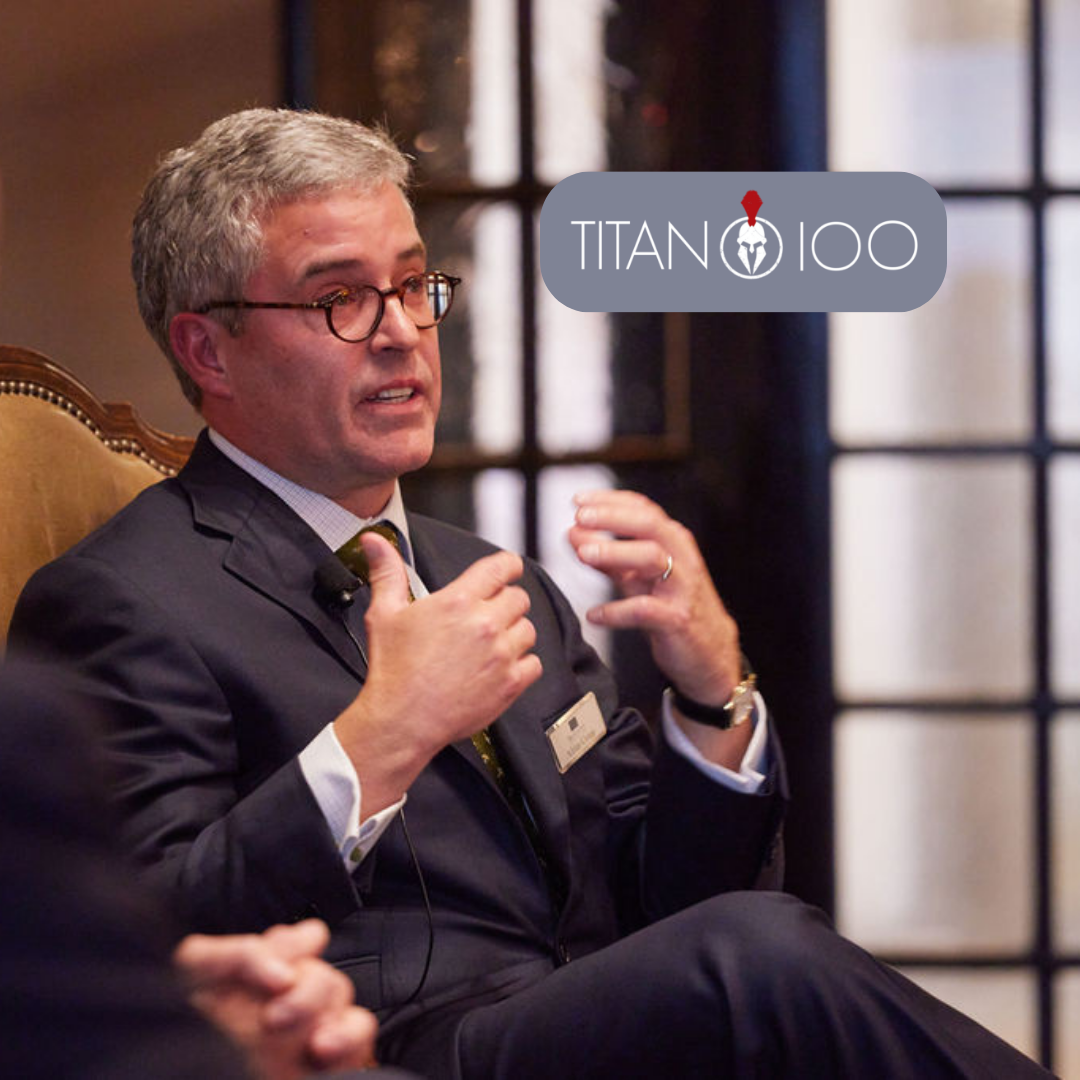
Adrian Cronje Is a 2026 Georgia Titan 100 Honoree
This distinction celebrates visionary leadership and meaningful impact, recognizing Adrian’s commitment to excellence and placing him among an exceptional group of leaders shaping Georgia’s business community.
.png)
A Healthy Consolidation
We explore our conviction that recent market performance points not to an end of momentum, but to a healthy consolidation across both public and private markets—one that reinforces the foundation for future opportunity. We reflect on performance throughout 2025, take a closer look at the fourth quarter, and share our perspective on the key risks and opportunities shaping 2026.
.png)
Entrepreneurs Can Invest Like the 1%
With a knack for navigating uncertainty, entrepreneurs are uniquely suited for private capital investing, a powerful tool for building long-term portfolios and lasting legacies. In this Entrepreneur article, Mark Bell shares four steps to get started.

How You Spend Your Time Is Your Legacy
Money can buy freedom but not fulfillment. In this FastCompany piece, Adrian Cronje explores how to align your time, energy, and focus with what truly matters. Because in the end, your legacy isn’t built on what you’ve earned, but on how you chose to spend your days.
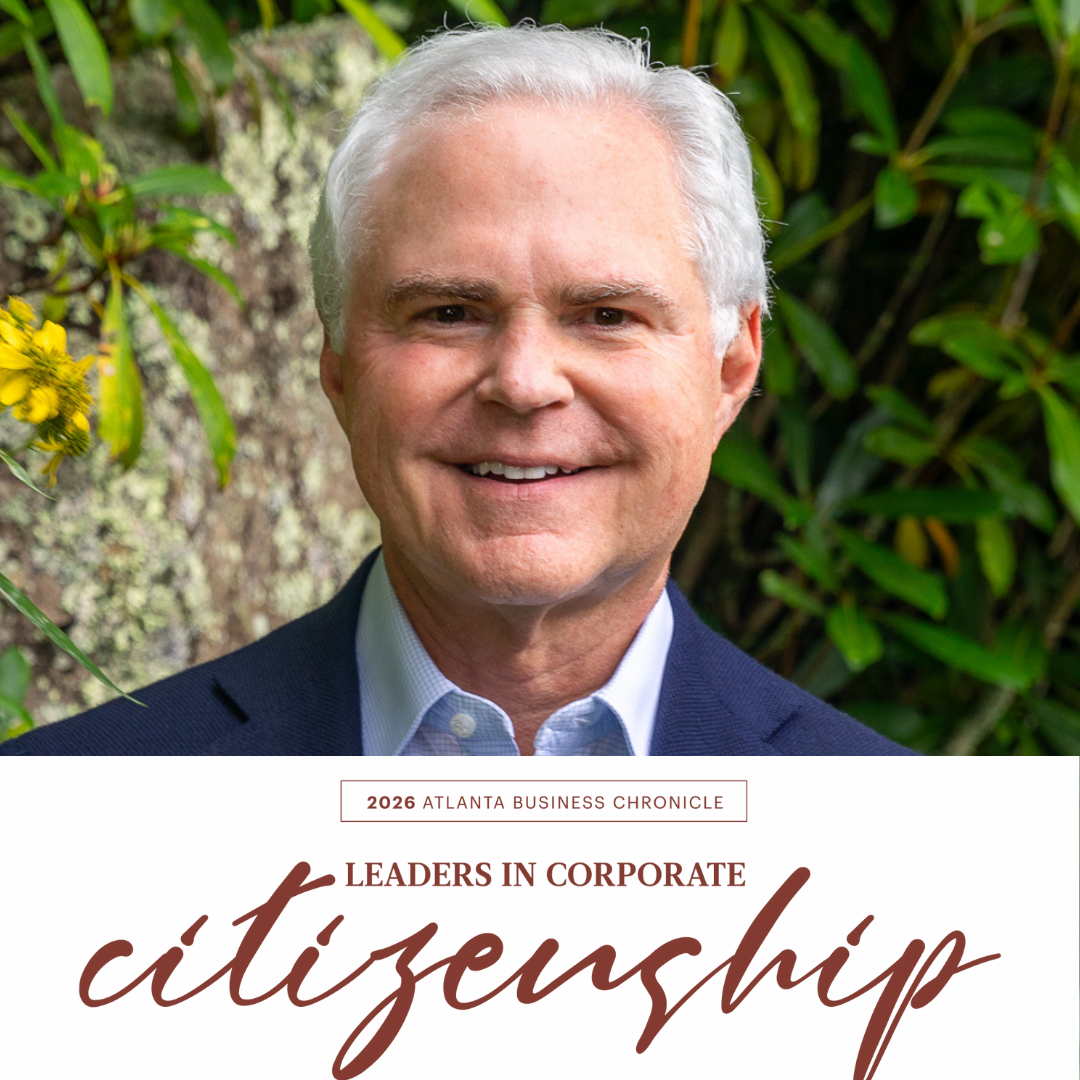
Robert Balentine Honored With Lifetime Achievement Award
Founder of Southern Highlands Reserve and a longtime leader in Atlanta’s civic community, Robert Balentine receives the 2026 Lifetime Achievement Award from The Atlanta Business Chronicle.
.png)
Balentine Becomes A Third-Generation Family Firm
With Emily's election to Partner, our firm leadership reflects the spirit of multigenerational stewardship we seek to help our client families cultivate.
Michael E. Pearson Elected Principal
Mike will help shape firm strategy, strengthen collaboration, and guide teams through an increasingly complex regulatory landscape.
Emily Balentine Barbour Elected Partner
Emily's lived experience and deep passion for client service uniquely position her to drive the firm’s next phase of growth.
Robert Vann, Jr. Joins Balentine as Senior Relationship Manager, Multi-Family Office
With more than two decades of experience as an attorney and wealth advisor, Robby will partner with multigenerational families to protect, preserve, and sustain their legacy.

What Stories Do You Want to Share This Holiday Season?
We've created two simple guides to help you spark meaningful conversations with your family.
.png)
Letting Go Is A Leadership Skill
In this Fast Company piece, Adrian Cronje explores what entrepreneurs can learn from wealth management: that real leadership means empowering others to thrive without you—and knowing when to step back so your vision can grow.
%20(1).png)