%20(1).png)
Deja Vu in the Nasdaq
%20(600%20x%20432%20px).png)
.webp)
This article was featured in the Georgia Association of Public Plan Trustees Newsletter.
For investors watching markets since late 2022, it feels like a rerun of 1995 to 1999. The Nasdaq has since risen more than 150% since it’s late-2022 bottom, and artificial intelligence now dominates the conversation much as the internet once did. Reviewing the businesses, growth, and market structure behind this rally reveals a market that may rhyme with history but is anchored in meaningfully stronger fundamentals.
The Businesses Powering The Rally
A comparison of Big Tech leaders across eras highlights both similarities and critical differences:
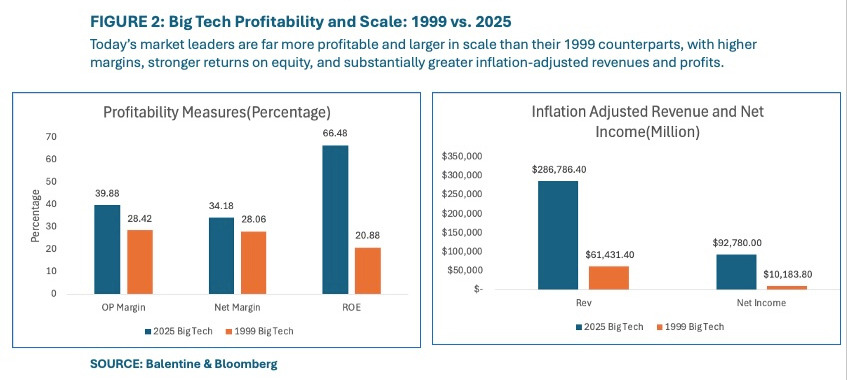
- In 1999, Intel, Cisco, IBM, Oracle, and Microsoft were dominant. They averaged operating margins of 28% and net margins of 21%, with strong returns on equity (28%). On an inflation-adjusted basis, they generated $61 billion in revenues and $10 billion in profits. These businesses had proven revenue and profits, even if many “dot-com” peers did not.
- Today, Nvidia, Microsoft, Apple, Meta, and Alphabet are even stronger. Operating margins are nearly 40% better than 1999’s Big Tech, net margins are 64% higher, and returns on equity are more than double. Revenues and profits are several times larger than their 1999 counterparts, even after adjusting for inflation.
Valuation Spell out Exuberance For Now
Strong leaders tell us the fundamentals are real. But bubbles aren’t about individual businesses – they’re about what the whole market is willing to pay, regardless of whether businesses are good or bad.
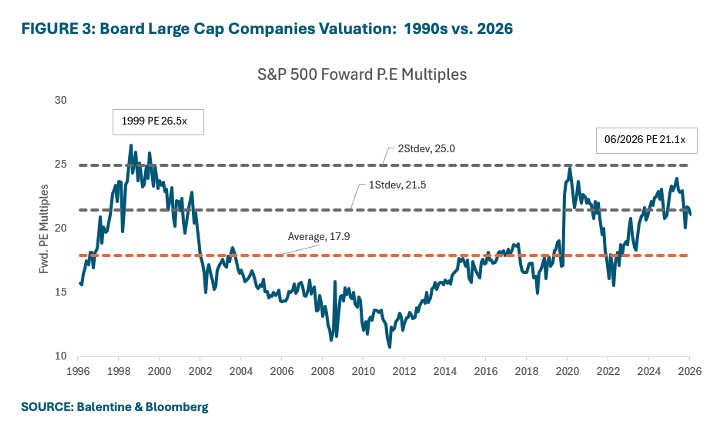
The takeaway: While headline index levels have kept climbing, broad-market valuation have actually compressed in 2026 as earnings growth outpaced price gain, and the underlying businesses supporting them are far more profitable, diversified, and globally embedded than those of the prior era. Today, Big Tech stocks count for nearly 30% of the index compared to 15% in the height of March 2000.
Growth Ran Slower Than the 1990s – Until it Reaccelerated, Closing the Gap
When we shift from fundamentals to growth, the story becomes more nuanced and more encouraging than it was even six months ago. For most of this cycle, the broad market grew more slowly than its 1990s counterpart:
- Revenue CAGR (1995-2000): 14.5% vs. 7.7% (2020–2025) vs. 27.7% (Q1 2026)
- Earnings CAGR: 20% vs. 10.7% vs. 11.4%
This difference reflects the nature of each innovation cycle. The late 1990s represented the broad birth of Internet adoption. The past five years have been characterized more by platform upgrades—until recently.
Nvidia stands as a major exception.
NVIDIA’s 99.4% compound annual net income growth since 2019 far exceeds Cisco’s 46% peak. Nvidia’s extraordinary profitability and capital efficiency have made it the most valuable company in the S&P 500—a milestone no Dot-Com-era peer achieved.
The takeaway is twofold:
- Mega-cap tech P/E multiples remain elevated, but unlike in 1999, when prices ran far ahead of profits, broad market multiples have compressed this year as earnings growth has outpaced price gains. Higher margins and returns on equity continue to justify premium multiples for the leaders.
- If generational technologies such as generative AI, advanced semiconductors, or biotech breakthroughs prove as transformational as Internet 1.0, growth could reaccelerate. Indeed, in Q1 2026, S&P 500 earnings grew over 27% year-over-year, the fastest pace since 2021, with full-year consensus estimates near 24%. AI-infrastructure beneficiaries accounted for roughly half of that growth.
Technology-Fueled Rallies Advance in Waves – In the 1990s and Today
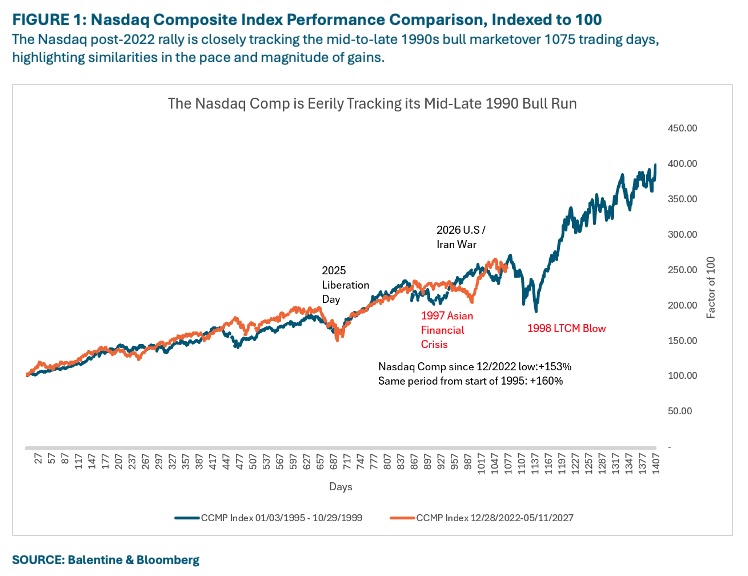
Fundamentals explain part of the story; market behavior explains the rest. In Figure 4, we can see the Nasdaq Composite has risen roughly 153% since its late December 2022 low, eerily mirroring its mid-1990s bull run. Indexed comparisons show the Nasdaq today (orange line) almost perfectly tracks the path of 1995–1998 (blue line).
A few observations stand out:
- Macro backdrops align. Both eras followed Fed rate shocks (1994 and 2022) and were catalyzed by disruptive technologies—the Internet in 1995, generative AI in 2022. Netscape’s IPO in 1995 validated the web; ChatGPT’s launch in late 2022 did the same for AI.
- The trajectory is remarkably similar. On day 1075 (as of 06/30/2026) of the rallies, the Nasdaq was up 160% in 1997 vs. 153% in 2026. Even pullbacks—like Greenspan’s “irrational exuberance” speech in 1996—echo today’s tariff and rate jitters.
- The roadmap suggests more upside, though with volatility. From the equivalent point in mid-1998, the NASDAQ fell nearly 30% during the Long Term Capital Management (LTCM) crisis before staging its most powerful rally of the cycle, more than doubling over the following 18 months. Tech-led bull markets often face policy or growth scares but recover as adoption broadens and accelerates.
This pattern underscores a key point: technology-driven bull markets rarely move linearly. They often advance in waves, with consolidation periods that reflect policy uncertainty rather than structural deterioration.
We Believe The Bull Market Has Room to Run
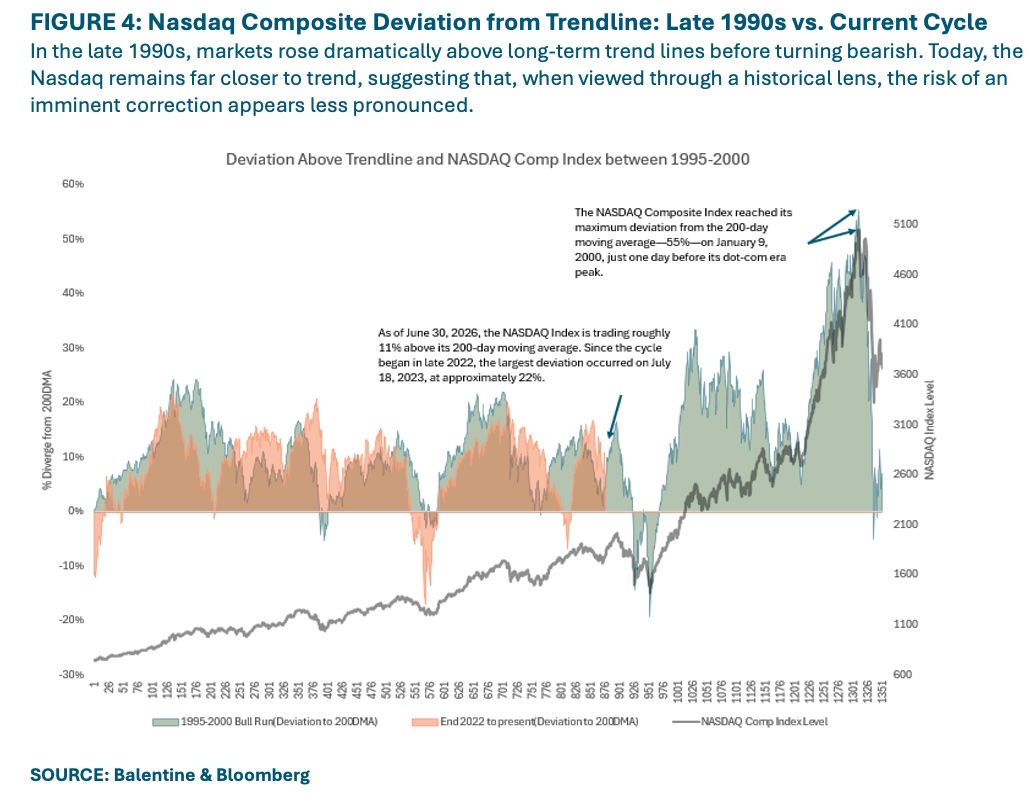
Many investors worry that we’re in the midst of an AI-driven bubble — and that when it bursts, it will trigger a sharp market correction. After three consecutive years of double-digit returns in the S&P 500 and a strong return so far in 2026, with the index reaching an all-time high , those concerns are understandable. However, our study of past market cycles suggests the current environment may still have room to run. In the early 2000s, markets showed a dramatic rise well above long-term trend lines before turning bearish. Today, we are not seeing that same level of extreme deviation, indicating that, when viewed through a historical lens, the risk of an imminent correction appears less pronounced.
A Market That Rhymes, Not Repeats
It's understandable that today's environment evokes the late 1990s. Yet the backdrop differs: today's giants are larger, more profitable, and more efficient than their predecessors, with far stronger structural foundations.
We believe this isn't a repeat of the past, but a new chapter anchored in stronger fundamentals we'll continue to monitor.
The opinions expressed are those of Balentine. The opinions referenced are as of the date of publication and are subject to change due to changes in the market or economic conditions and may not necessarily come to pass. Forward looking statements cannot be guaranteed. Material presented has been derived from sources considered to be reliable, but the accuracy and completeness cannot be guaranteed. Past performance is not indicative of future results.Balentine LLC ("Balentine") is an investment adviser registered with the U.S. Securities and Exchange Commission. This information has been prepared by Balentine LLC ("Balentine") and is intended for informational purposes only. This information should not be construed as investment, legal, and/or tax advice.

Browse our collection of resources from trusted thought leaders.
Balentine experts offer their authentic take on the latest financial topics, including our exclusive market publications, news, community events, and more.

.webp)
Eyes On The Road
.jpg)
Money Compounds, But Trust Compounds Faster

%20(1).png)